Evaluation of Space-borne LIDAR for Terrain Feature Extraction and Mapping
The major objective of this study is to evaluate the potential of space-borne LIDAR (Light Detection and Ranging) data for extraction and mapping of various terrain features. The data obtained from GLAS (Geoscience Laser Altimeter System) on-board ICESAT (Ice, Cloud and land Elevation Satellite), a space-borne LIDAR launched by NASA in January 2003 for continuous global observations of the Earth, is used in this study. GLAS emits a 1064 nm (for surface topography) laser pulse toward Earth’s surface. It has a large foot print of 70 m, successive laser pulses are shot spaced at 172 m along-track. Sahaspur area in the western Dehradun Valley of Uttarakhand State, India, is taken as the test site (Fig. 1).
The analysis was carried using direct LIDAR return data (amplitude) and LIDAR waveform data. A customized tool was developed for reading, visualizing and analyzing ICESAT LIDAR data. The LIDAR-derived heights were compared with the height generated from SRTM (Shuttle Radar Topography Mission) and CARTOSAT-1. The maximum difference of about 18 m was observed with reference to CARTOSAT-1. In case of bare ground areas, the accuracy is of the order of half a meter with reference to ground-measured heights. Hence, ICESAT data of bare earth locations can be used as ground control points for generating DEMs, either by stereo-photogrammetric or interferometric SAR techniques. Tree and building heights, and canopy structure (Fig. 1d) were extracted using laser waveform data, and subsequently bare earth height (DEM) was determined and validated with ground-measured heights at few locations (R2 = 0.998).

Fig. 1: (a), (b) ICESAT GLAS foot print, (c) ground photo of forest, and (d) tree canopy structure profile from LIDAR waveform data
Mapping Aerosol Optical Depth using IRS-P4 OCM and SeaWiFS Data.
Aerosol optical depth (AOD) derived from SeaWiFS (Sea-viewing Wide Field-of-view Sensor) and MODIS (Moderate Resolution Imaging Spectroradiometer) sensors data are routinely used by the scientific community in various climatic studies. An attempt is made to retrieve the AOD using IRS-P4 OCM (Ocean Colour Monitor) sensor data, and the results are compared with that obtained from SeaWiFS and MODIS data.
It is found that in general the OCM retrieved AOD is in good agreement with that retrieved from SeaWiFS as well as MODIS (Fig. 2). OCM retrieved AOD is, however, closer to SeaWiFS (correlation=0.88, slope=0.96 and intercept=-0.013) compared to MODIS (correlation=0.75, slope=0.91 and intercept=0.0198). The RMSE are found to be ±0.0522 between OCM and SeaWIFS and ±0.0638 between OCM and MODIS. The mean percentage difference indicates that OCM retrieved AOD is 12% higher compared to SeaWiFS and 8% higher compared to MODIS. The mean absolute percentage between OCM derived AOD and SeaWiFS is found to be less (16%) compared to OCM and MODIS (20%). The closer agreement between OCM and SeaWiFS, mainly attributed to closer time of pass, can thus be used to fill the gap areas of SeaWiFS retrieved AOD with the AOD retrieved from OCM data (Fig. 3) using the statistical relationship.
Fig. 3: Aerosol optical depth at 865 nm from SeaWiFS (left), and combined OCM, SeaWiFS (right) data.

Fig. 2: Aerosol optical depth at 865 nm (OCM, SeaWiFS) and 869 nm (MODIS).
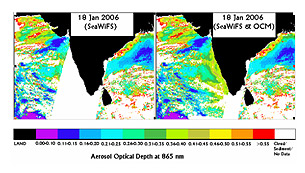
Fig. 3: Aerosol optical depth at 865 nm from SeaWiFS (left), and combined OCM, SeaWiFS (right) data.
Detecting and Measuring Land Subsidence around Bandung City, Indonesia using D-InSAR, GPS and Aquifer System Compaction Measurements.
Bandung, the capital city of West Java Province, Indonesia, and surrounding urban/industrial areas of Bandung Basin are reported to have been subsiding since long. In this work, an integrated approach adopting collateral measurement techniques namely, space-borne differential interferometric synthetic aperture radar (D-InSAR), multi-epoch GPS observations and aquifer system compaction, has been attempted for studying land subsidence phenomena in the area during post-2000 period.
Space-borne D-InSAR technique depicts three well-defined subsidence-affected patches in and around (i) Cimahi Selatan, (ii) Bandung Central, and (iii) Dayeuh Kolot areas (Fig. 4) with the maximum rates of subsidence 15.8 cm/year, 13.3 cm/year and 12.8 cm/year respectively during post-2000 period (2005-2006). The results from carrier phase based dual-frequency GPS survey in classical static mode show the corresponding subsidence rates of 14.1±0.3 cm/year, 13.4±0.2 cm/year, and 9.2±0.4 cm/year and 8.9±0.2 cm/year. The mean aggregated piezometry-induced aquifer system compaction rates in Cimahi Selatan, Bandung Central and Dayeuh Kolot areas are estimated as 20.35 cm/year (Range:16.22–24.48 cm/year), 11.27 cm/year (Range: 8.92–13.62 cm/year), and 15.06 cm/year (Range: 8.81–21.32 cm/year) respectively, being quite close (though slightly over-estimated) to D-InSAR and GPS-based measurements (Fig. 5). The study infers groundwater over-extraction as the main cause of land subsidence in the area
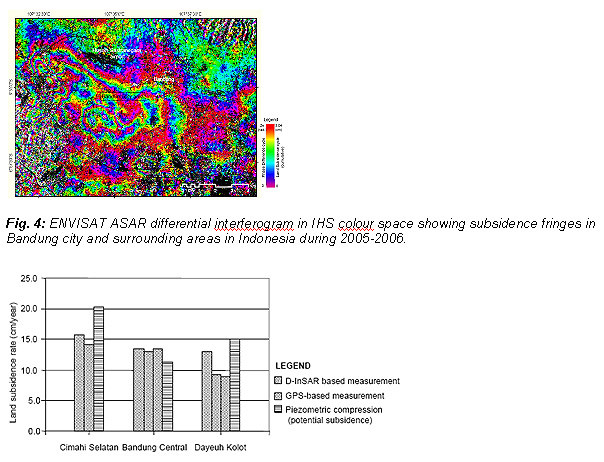
Fig. 5: Comparison of subsidence results from D-InSAR, GPS and aquifer system compaction measurement techniques.
Identification and Mapping of Rat-hole Type Coal Mines as a Source of Acid Mine Drainage using High Resolution Satellite Data : An Example from Jaiñtia Hills of North-eastern India.
In this study, an attempt is made to use high-resolution satellite data obtained from CARTOSAT-1 PAN (spatial resolution – 2.5 m) and RESOURCESAT-1 LISS-IV (spatial resolution – 5.8 m) for identifying and mapping the artisanal rat-hole type coal mines in the central part of the Jaiñtia Hills District of Meghalaya, India. A typical rat-hole mine has one small diameter shaft, sunk up to the depth of coal seam, with holes/burrows dug horizontally in all directions on the wall of the shaft following the coal seam (Fig. 6). Geochemical analysis of surface water and sediment samples is also carried out to study the effect of coal mining on surface water quality and stream bed sediments.
Based on visual analysis, it is found that the high resolution satellite images mentioned above have potential to identify and detect the rat-hole type coal mines which typically appear as near-circular white patches (representing overburden dumps) with black spot (representing shaft) in the centre (Fig. 7). An algorithm using the object-oriented classification approach is also developed to (semi)automatically map such mines with moderately good accuracy. The chemical analysis of stream-water and stream-bed sediments during the monsoon and post-monsoon periods indicate the presence of acid mine drainage (AMD) with abnormally low pH, high acidity, and high SO4 and Fe contents in stream-water as well as high concentration of Fe in stream-bed sediments in proximity to these coal mines.
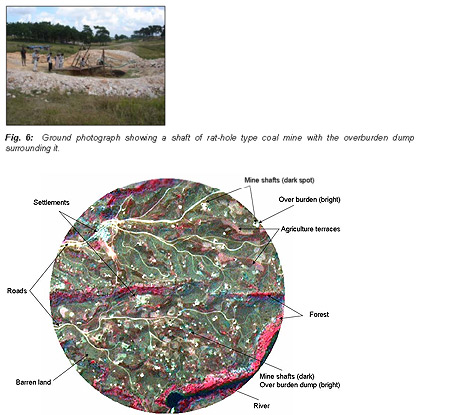
Fig. 7: CARTOSAT-1 PAN and RESOURCESAT-1 LISS-4 merged FCC depicting rat-hole type coal mines and other landscape features.
Characterizing Snow Cover in Parts of Himalaya using Active MicrowaveRemote Sensing.
Active microwave remote sensing, especially the synthetic aperture radar (SAR), offers all-weather and all-season imaging capability to monitor the inaccessible Himalayan snow and glacier cover. A study is carried out to use SAR data obtained from multiple satellites (C-band ENVISAT ASAR, L-band ALOS-PALSAR, X-band TerraSAR-x) for mapping the spatial extent and characterizing the physical properties of snow cover in parts of Himalaya. Manali area in Himachal Pradesh State and Gangotri area in Uttarakhand State of India are taken as test sites.
The processing of SAR data, such as importing and multi-looking into power images, geocoding with the help of SRTM DEM and Landsat ETM+ orthorectified image, and generation of backscatter images, was carried out using SARSCAPE software. Multi-date image thresholding method with backscatter ratio (σwet/σdry) of -3db was used to classify the wet snow cover (Fig. 8a). The backscatter thresholding algorithms were used to find the dry snow and glacier covered area with single SAR image datasets. It has been observed that HH-polarization image under-estimates the snow cover area as compared to HV-polarization image (Fig. 8b, c). Further work on snow parameter retrieval is in progress.

National Carbon Project:
In order to understand the terrestrial carbon cycle over India, a comprehensive study through ‘National Carbon Project’ (NCP) has been taken up under the ISRO-Geosphere Biosphere Programme (IGBP). The major goals of NCP are:
- Assessment of Carbon Pools, Fluxes and Net Carbon balance for terrestrial biomes in India
- To establish an observational network and create remote sensing-based spatial databases for modeling and periodic assessment of net carbon balance in India
- To provide support to Second National Communication (SNC) activity of Ministry of Environment and Forests, GOI to UNFCCC with respect to carbon balance.
The project is being implemented as a set of three inter-related sub-projects, namely:
- Vegetation Carbon Pool Assessment
- Soil Carbon Pool Assessment
- Soil & Vegetation – Atmosphere Carbon Fluxes
Vegetation Carbon Pool Assessment
The sub-project on Vegetation Carbon Pool (VCP) assessment has been taken up to assess the above ground carbon in different vegetated ecosystems such as forests, agriculture, trees-outside-forest, etc. The project aims to develop RS-based methodology to assess national level carbon availability. The project is being implemented in a collaborative mode with participation of central and state government Depts. including various ISRO centers, state forest departments, universities, etc. Methodology has been developed and the manpower in different regions of the country has been trained for data collection. Field data are being collected at about 2000 sites spread across the country. This project will also explore various RS-based upscaling techniques for converting point-based field biomass to spatial C maps.
Soil Carbon Pool Assessment
The sub-project on Soil Carbon Pool (SCP) assessment has been taken to generate spatial datasets on soil carbon density (both organic and inorganic carbon, up to 1 m depth) along with estimates of uncertainty, and to estimate the total soil C pool in India. Remote sensing and GIS techniques are used for mapping the spatially homogeneous units based on dominant landforms, terrain slope, agro-ecological sub-region (AESR) and land use/land cover. These spatially homogeneous units are used for deciding the field sampling locations and then upscaling the point-based observations on soil organic and inorganic carbon. The data generated in the project is centrally pooled and processed for generating national spatial database on soil carbon pools (total, organic and inorganic) in GIS environment. As the outcome of this project will be one of the basic inputs in the C-cycle modeling, it is planned to generate output maps in 10 km x 10 km gridded framework.
Soil & Vegetation – Atmosphere Carbon Fluxes
The sub-project on Soil & Vegetation – Atmosphere Carbon Fluxes (SVF) focuses on terrestrial CO2 flux measurements in different ecological regions of the country and the use of this data synergistically with the remotely sensing and other data to determine the source and sink strengths of different biomes in the country. The major tasks identified in this sub-project are – (1) establish atmospheric CO2 measurement network and analyze CO2 fluxes; (2) use of satellite based atmospheric retrievals of CO2 to analyze source-sink patterns of carbon; (3) establishment of eddy-flux based observation network to monitor net carbon exchange; (4) measurement and modeling of soil respiration/emission fluxes; (5) up-scaling of carbon assimilation fluxes to regional scale using satellite remote sensing; (6) evaluation of a spatial terrestrial carbon model for long-term simulation of C-cycle over India; (7) long-term simulation of air-sea CO2 exchanges over the Indian ocean; and (8) estimation and modeling of geochemical C fluxes-weathering, wetland efflux, sediment erosion and deposition, riverine and coastal C flows.
Landslide Hazard and Risk Analysis in Part of Garhwal Himalaya
Landslide susceptibility mapping is carried out along the National Highway–108 between Bhatwari and Gangnani in parts of Garhwal Himalaya, India using a multivariate statistical method (logistic regression) and the results are compared with the rock mass classification based slope stability probability classification (SSPC) method to evaluate the reliability of multivariate statistical method inidentifying potentially susceptible slopes (Fig. 9). Towards this, historical landslide data for the last 25 years were collected from Border Roads Organization (BRO). IRS LISS-III and PAN data were acquired for last 10 years (1997-2008) and landslide bodies were marked on the satellite images in consultation with BRO records. Landsat TM data and aerial photographs were also used to generate the landslide inventory. Nine different geo-environmental factors were derived from the high resolution CARTOSAT-1 and RESOURCESAT-1 images in conjunction with ground data. For hazard mapping, the landslide size (both area and volume information) along with their temporal probability of occurrence are considered for calculating the spatio-temporal probability. Quantitative methods are developed for landslide vulnerability analysis of the road stretch and vehicles moving on the roads. While attempting to calculate the building vulnerability, quantitative assessment is made for the damage of buildings as well as the people living inside various types of buildings
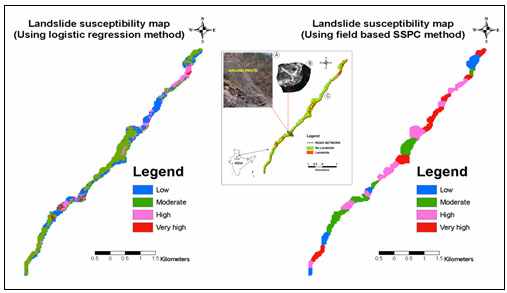
Fig. 9: Landslide susceptibility (spatial probability) maps generated using logistic regression and SSPC methods along part of the National Highway–108 in Uttarakhand. Inset shows the location map
Analysis of Surface Deformation and Seismicity Induced Landslides due to the October 8, 2005 Earthquake in Kashmir Himalaya.
The October 8, 2005 earthquake of Kashmir Himalaya (7.6 Mw) with its epicenter located within the Hazara syntaxis in Indo-Kohistan Seismic Zone caused numerous landslides and widespread surface deformations, apart from huge loss of life and property. Multi-resolution satellite data products such as Indian CARTOSAT-1, RESOURCESAT-1, Landsat-TM and ASTER are analyzed in order to detect the causative fault and to map landslides in a largely inaccessible affected region.
The CARTOSAT-1 and RESOURCESAT-1 data products revealed numerous landslides and extensive damage along the Jhelum valley and surrounding region. ASTER images, acquired during pre- and post-event periods with similar viewing geometry and co-registered by sub-pixel correlation, revealed a linear to curvilinear discontinuity that could be traced up to a distance of 86 km from Balakot to southwest of Uri corresponding to the causative fault of the present earthquake. Further, the fault was confirmed by field evidences as collected by several researchers. The ground deformation-cum-damage survey revealed that the hanging wall side of the causative fault was severely affected and caused numerous earthquake triggered landslides. The terrain parameters such as surface geology, slope gradient, slope aspect, curvature and relief classes were correlated with actual landslide occurrences and critical classes were identified. The statistical analysis of landslides inventory based on probability density function enabled estimation of earthquake magnitude and size of the largest landslide, which correspond well with the actual field data. The study estimated total landslide affected area (~67 km2) from the partial inventory of landslides based on satellite image interpretation.
Basin-scale Hydrological Modelling for Understanding Climate-Land Surface Interaction– A Case of Mahanadi Basin
This study attempts to model the hydrology and assess the impact of land cover change on stream flows in Mahanadi river basin (covering ~1,44,000 km2 in Chattisgarh and Orissa States of India) using a physical-based macro-scale hydrological model, VIC (Variable Infiltration Capacity). Satellite images are used to map the land cover in the basin for the years 1972, 1985 and 2003. The comparison of multi-date land cover maps revealed reduction in forest cover and barren land at the expense of water body, agriculture and buit-up land in a span of 30 years.
The model was calibrated at the basin outlet (Mundali outlet) for the year 2003 (Fig. 10). The model performance was found better for monthly simulations (Nash-sutcliffe coefficient, Ns= 0.89). Based on analysis of streamflows simulated for the years 1972, 1985 and 2003, it is observed that there is an increase in annual streamflow by 4.53% (24.4 mm) at Mundali outlet from 1972 to 2003, which is quite a significant amount in terms of volumetric rise (~3514 Mm3). Increase in annual streamflow was observed within sub-basins as well. This increase in streamflow may primarily be attributed to changes in land cover, especially decrease in forest cover.
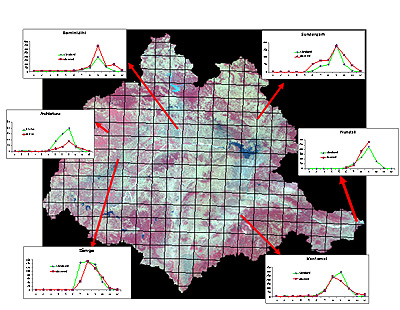
Fig. 10: Hydrologic simulation in Mahanadi Basin. Boxes show simulated (green) and observed (red) hydrographs at different outlets for the year 2003.
Process based Soil Erosion Modeling – A Case Study in Himalayan Watershed
A research study on process based modeling for understanding the runoff and erosion processes in the Himalayan landscape is carried out using a new generation WEPP (Water Erosion Prediction Project) model, both the Watershed and Hillslope versions. Sitla Rao watershed in the western Doon Valley in Dehradun District of Uttarakhand, India is taken as the test site. Field instruments, such as automatic weather station, self-recording rain gauges and stage level runoff recorder were established in the study area.
WEPP model run at hillslope scale helped to understand the infiltration and surface runoff generation and soil loss pattern along the hillslope. It revealed that runoff water infiltrated into mid-backslope and exfiltrated at lower-backslope leading to high rate of rill and inter-rill erosion at lower backslope, thus indicating high susceptibility of lower-backslope to soil erosion (Fig. 11). WEPP model run at watershed scale indicated that the simulated surface runoff match well (r2 = 0.69) with the observed runoff for rain events of low to medium rain intensity, while the model performance is found to be poor for high rain intensity. The results bring out utility of WEPP model for soil and water conservation planning at micro-/ mini-watershed level.
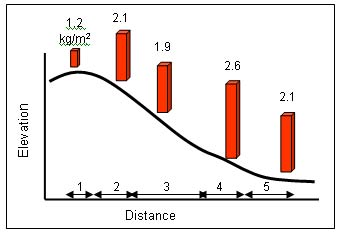
Fig. 11: Average soil loss simulated along hillslope using WEPP model. 1–Hilltop, 2–Upper-backslope, 3–Mid-backslope, 4–Lower-backslope, 5–Toe-hillslope
FAO-AEZ Approach for Agricultural Land Use Planning in Rainfed Agro-ecosystem
A spatially explicit FAO-AEZ approach is used to generate optimal agricultural land use plan in parts of central and north-western region of India (Rajasthan, Gujarat and Madhya Pradesh States) representing mainly rainfed agro-ecosystem. The FAO AEZ approach has the advantage that the production potential is assessed considering crop-specific limitations and potentials of prevailing climate, soil, and terrain resources.
The vector coverage of soil map (source: NBSS&LUP;) was prepared in Arc-GIS. The available water holding capacity (AWHC) was estimated for each soil mapping unit. Daily climatic data were compiled on a decadal and monthly basis, and then interpolated using FAO New LocClim software (v 1.03). Spatial monthly and decadal rainfall and potential evapotranspiration (PET) data were analyzed to estimate length of growing period (LGP) spatially. Crop-specific LGP and water limited yield potential were estimated using BUDGET software based on simple soil-water balance program by integrating the soil and crop characteristics. The crop-specific LGP and water limited yield potential were then integrated with FAO based crop-specific soil suitability maps to identify areas with highest potential for a specific crop in the region to optimize crop production (Fig. 12).
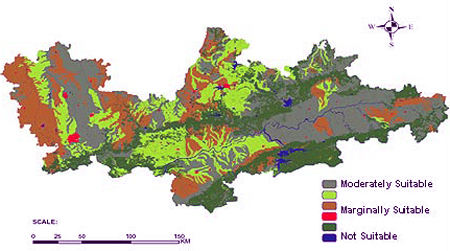
Fig. 12: Crop-specific (soyabean) suitability map in part of Madhya Pradesh State, India based on FAO-AEZ approach
Aerosol Climatology over Dehradun
Under the Aerosol Radiative Forcing over India (ARFI) project of ISRO–Geosphere Biosphere Programme (IGBP), continuous measurements on atmospheric aerosols are being made at Indian Institute of Remote Sensing (IIRS), Dehradun. These measurements help to characterize aerosol properties which when combined with meteorological parameters will provide vital information in describing the transport and behavior of the atmospheric aerosols.
The instruments being used for the measurements are – (a) Multi-wavelength Radiometer (MWR) for studying the spectral variation in aerosol characteristics at 10 narrow band wavelengths, (b) Aethalometer for measuring real-time concentration of black (or elemental) carbon (BC) aerosol particles, (c) High Volume Air Sampler for characterizing the aerosol particles into different sizes and for studying other physical properties, (d) Sunphotometer and Ozonometer for studying the optical properties of aerosols.
Mean monthly spectral variability of aerosol optical depth (AOD) obtained using MWR during 2008 and 2009 shows relatively strong wavelength dependence at shorter wavelengths that gradually decreases towards longer wavelengths which may be attributed to the dominance of accumulation mode particles (Fig. 13). The AOD values are comparatively lower (0.08-0.38) during winter (December–February) than during summer (March-June) period (0.32-0.62). A slight increase in AOD is also observed at longer wavelengths during summer, suggesting presence of high concentration of coarse mode particles. Further, it is observed that the afternoon AOD values are relatively higher which may be attributed to convective mixing and cloudy sky conditions.
It is observed that prevailing meteorological conditions play a significant role in regulating the concentration of BC. The BC concentration decreases during the period of heavy rainfall (July–August) and increases during the dry months (Fig. 14). The BC concentration is highest in December (7500 ng m-3) and is lowest in August (2320 ng m-3). The annual average BC concentration over Dehradun is about 4300 ng m-3.
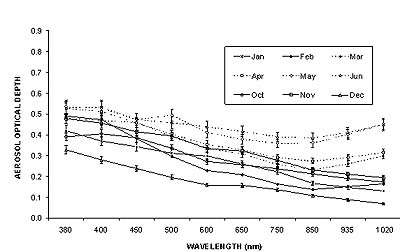
Fig. 13: Mean monthly spectral variability of AOD over Dehradun. Vertical bars denote the standard deviation from mean.
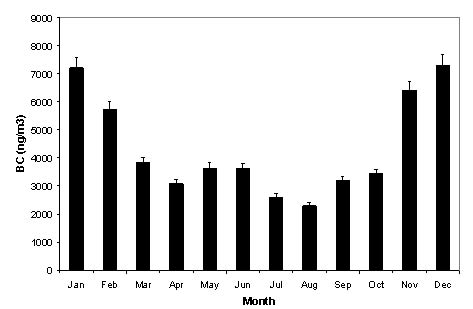
Fig. 14: Mean monthly BC concentration over Dehradun. Vertical bars denote the standard deviation from mean.
Urban Growth Modelling – Example of an Indian City
Appropriate models that could predict future urban growth in an accurate manner are essential to help the authorities taking proper policy and planning measures. In this study, an Artificial Neural Network (ANN) based model is applied to simulate the urban growth of Saharanpur city in India. In the proposed model, remote sensing and GIS were used to generate site attributes, while ANN was used to reveal the relationships between urban growth potential and the site attributes. Once the ANN learnt the relationship, it was then used to simulate the urban growth. Different feed forward ANN architectures were evaluated on a cell by cell matching using Kappa index and three spatial metrics namely, Mean Patch Fractal Dimension, Landscape Shape Index and Percentage of like Adjacencies. Finally, the most optimum ANN architecture was selected for future growth simulation (Fig. 15).
The study demonstrates that the ANN based model can objectively simulate urban growth and reduce calibration time, besides successfully coupling GIS, remote sensing and ANN. Further, the present model can be used as an urban planning tool to develop projected growth scenarios and answer “what-if” type questions.
Further, such models can also be extended to provide an objective understanding of various complex dynamic systems and predicting their future states. For example, such models can also be applied to simulate future land-use and land-cover (LULC) changes, which will form baseline input datasets in global change/carbon cycle models and hydrological models to understand the linkage among LULC change, climate, water cycle, etc
Understanding and Modeling the Regional Carbon Cycle over India and Surrounding Oceans
As part of National Carbon Project (NCP), long-term simulation of Net Primary Production (NPP), Net Ecosystem Production (NEP), and soil organic carbon content over terrestrial India during 1981-2003 are carried out by using time-varying inputs of satellite greenness index (NDVI), solar radiation, air temperature, precipitation, soil and vegetation cover in the Carnegie–Ames–Stanford Approach (CASA), a terrestrial biosphere model. It is found that there is an increase in NPP (0.007 Pg C Yr-2 or 8.5%) during the last 22 years over most part of the country, barring forested regions, because of increased productivity over agricultural lands. The study also revealed that climate plays a relatively small (6%) but significant control on the increasing trends of NPP. The analysis of NEP and SOC trends is in progress.
CO2 fluxes over the tropical Indian Ocean during 2000–2008 are estimated using data of several key parameters of CO2 exchange process as input in a semi-empirical model. The key parameters include partial pressure difference of absorbed CO2 between ocean and atmosphere, wind speed at the sea surface, sea surface temperature and sea surface salinity. The estimated fluxes are mostly positive over the north Indian Ocean (north of 10oS) and negative over the south tropical Indian Ocean (30oS–10oS). Arabian Sea is the major source of atmospheric CO2. There exists a strong seasonal and inter-annual variability in the estimated flux.
Seasonal and inter-annual variability of mid-tropospheric CO2 data over India and surrounding ocean during 2002–2008 based on AIRS (Atmospheric InfraRed Sounder, on-board NASA's AQUA satellite) observations and their relation with surface fluxes (source and sink) are analyzed. The study reveals that the terrestrial biospheric flux exchanges over India and oceanic flux exchanges over the south Indian Ocean appear to be the dominant controlling factors on seasonal variability of atmospheric CO2 concentration. On inter-annual scale, fluxes over the terrestrial India and over the north Indian Ocean, in particular over the Arabian Sea, may play significant role on the control of atmospheric CO2 concentration.
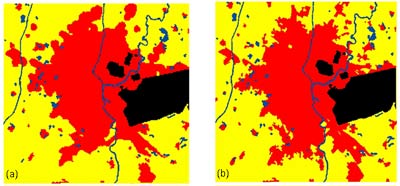
Fig. 15: Comparison of simulated (a) and actual (b) growth for Saharanpur city, India, for the year 2001. Red–built-up area, yellow–non built-up area, blue–water body, black–restricted area. North is towards top and each box covers an area of about 9 km x 9 km.


